Living Liquid: Public exploration of scientific data
Living Liquid was a research and development project I conceived of and led at the Exploratorium. A collaboration with the U.C. Davis Center for Visualization and scientists at the University of Hawai’i, MIT, and Stanford, this project created three large, interactive visualizations of ocean science data for public exploration. In addition to three large-scale public installations, the project included a multi-year research study to advance our understanding of how the public uses scientific data in museums with several peer reviewed publications (led my Dr. Joyce Ma), and residencies that trained computer science, marine biology, and other graduate students in visualization and communication design. The project was supported by multiple grants from the National Science Foundation (DRL 111128, 1322828) and the Gordon and Betty Moore Foundation.
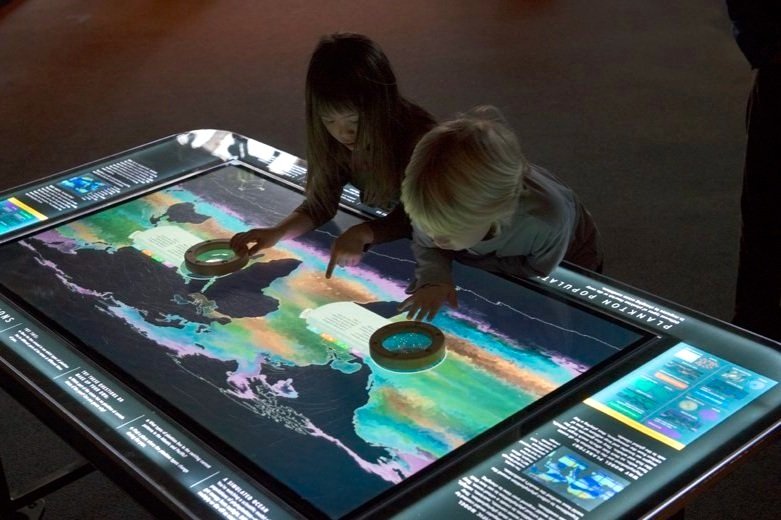
Plankton Populations is an interactive visualization in the Living Systems Gallery at the Exploratorium. Museums visitors can explore where microscopic marine life, more familiarly known as plankton, live in the world’s oceans. Global patterns can be explored on the interactive tabletop, while a glass lens zooms into to local data. Tabs show the underlying environmental conditions, such as temperature and nutrients, to show the relationship between living things and the environment. The exhibit uses real data from the MIT Darwin Project, and was created in collaboration with MIT and the U.C. Davis Center for Visualization.
Mapping Migrations is an interactive visualization at the Exploratorium that transforms a large dataset from the Tagging of Pacific Predators project based at Stanford University into a tool for public exploration. Museum visitors can watch the paths of tuna, sharks, whales, and other marine creatures as they move through the Pacific throughout the year. Through observation and tools that allow filtering by animal, sex, and tagging locations, visitors can uncover patterns in where these animals go and why. This exhibit was created with marine biologists from Stanford, and computer scientists from the U.C. Davis Center for Visualization.
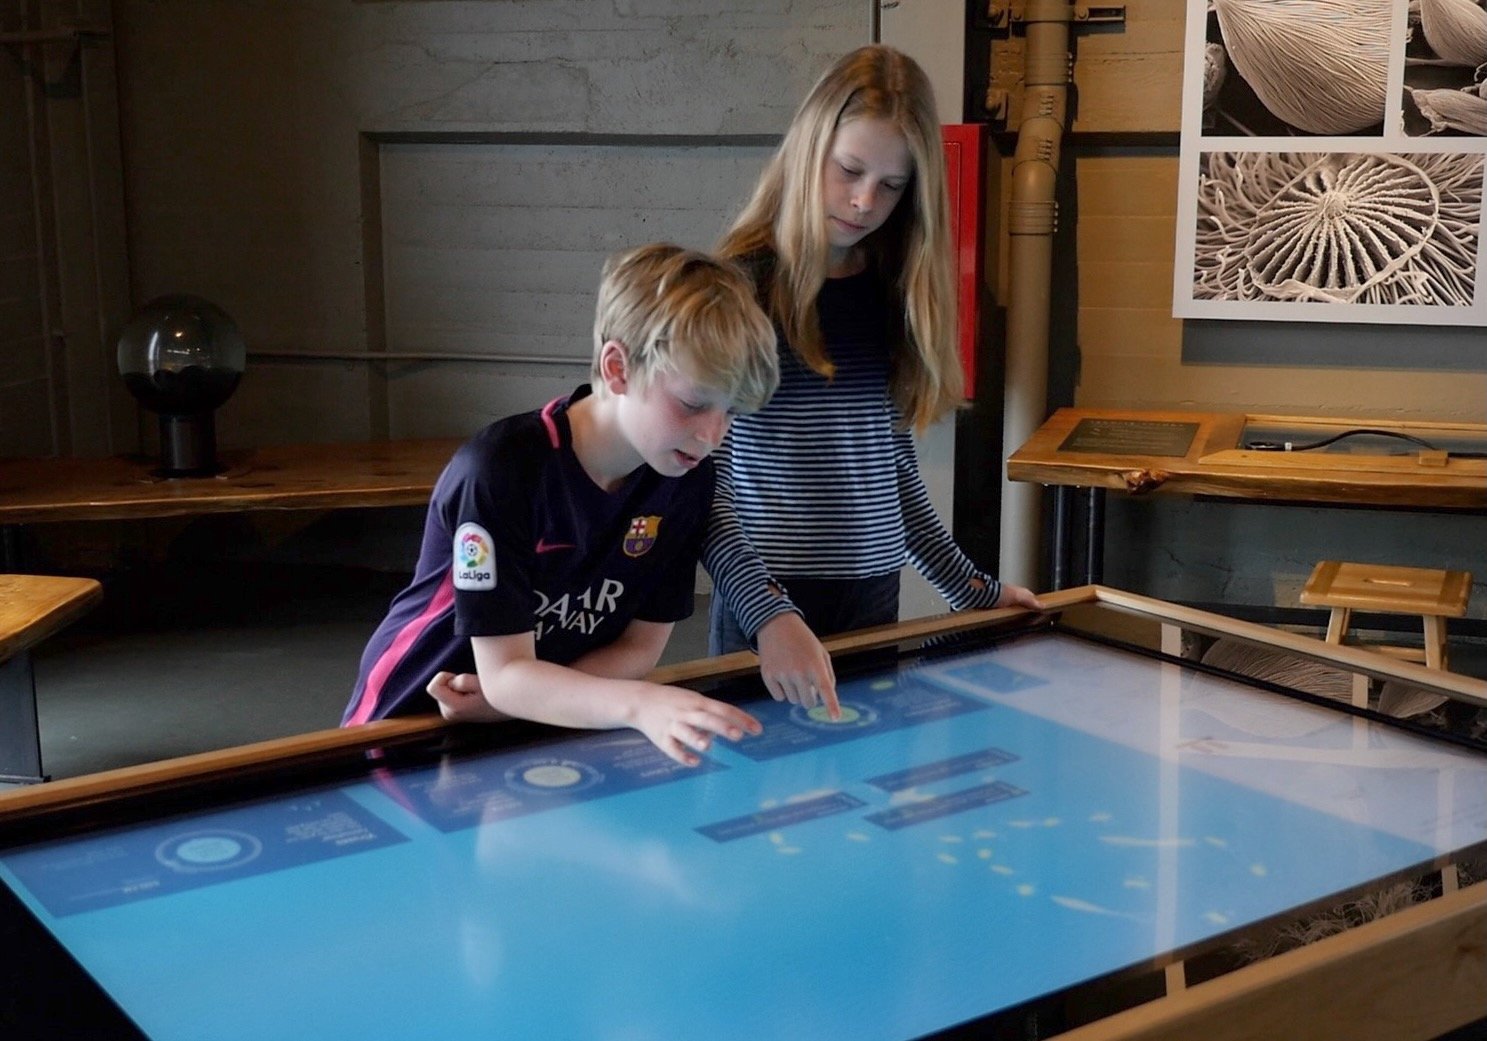
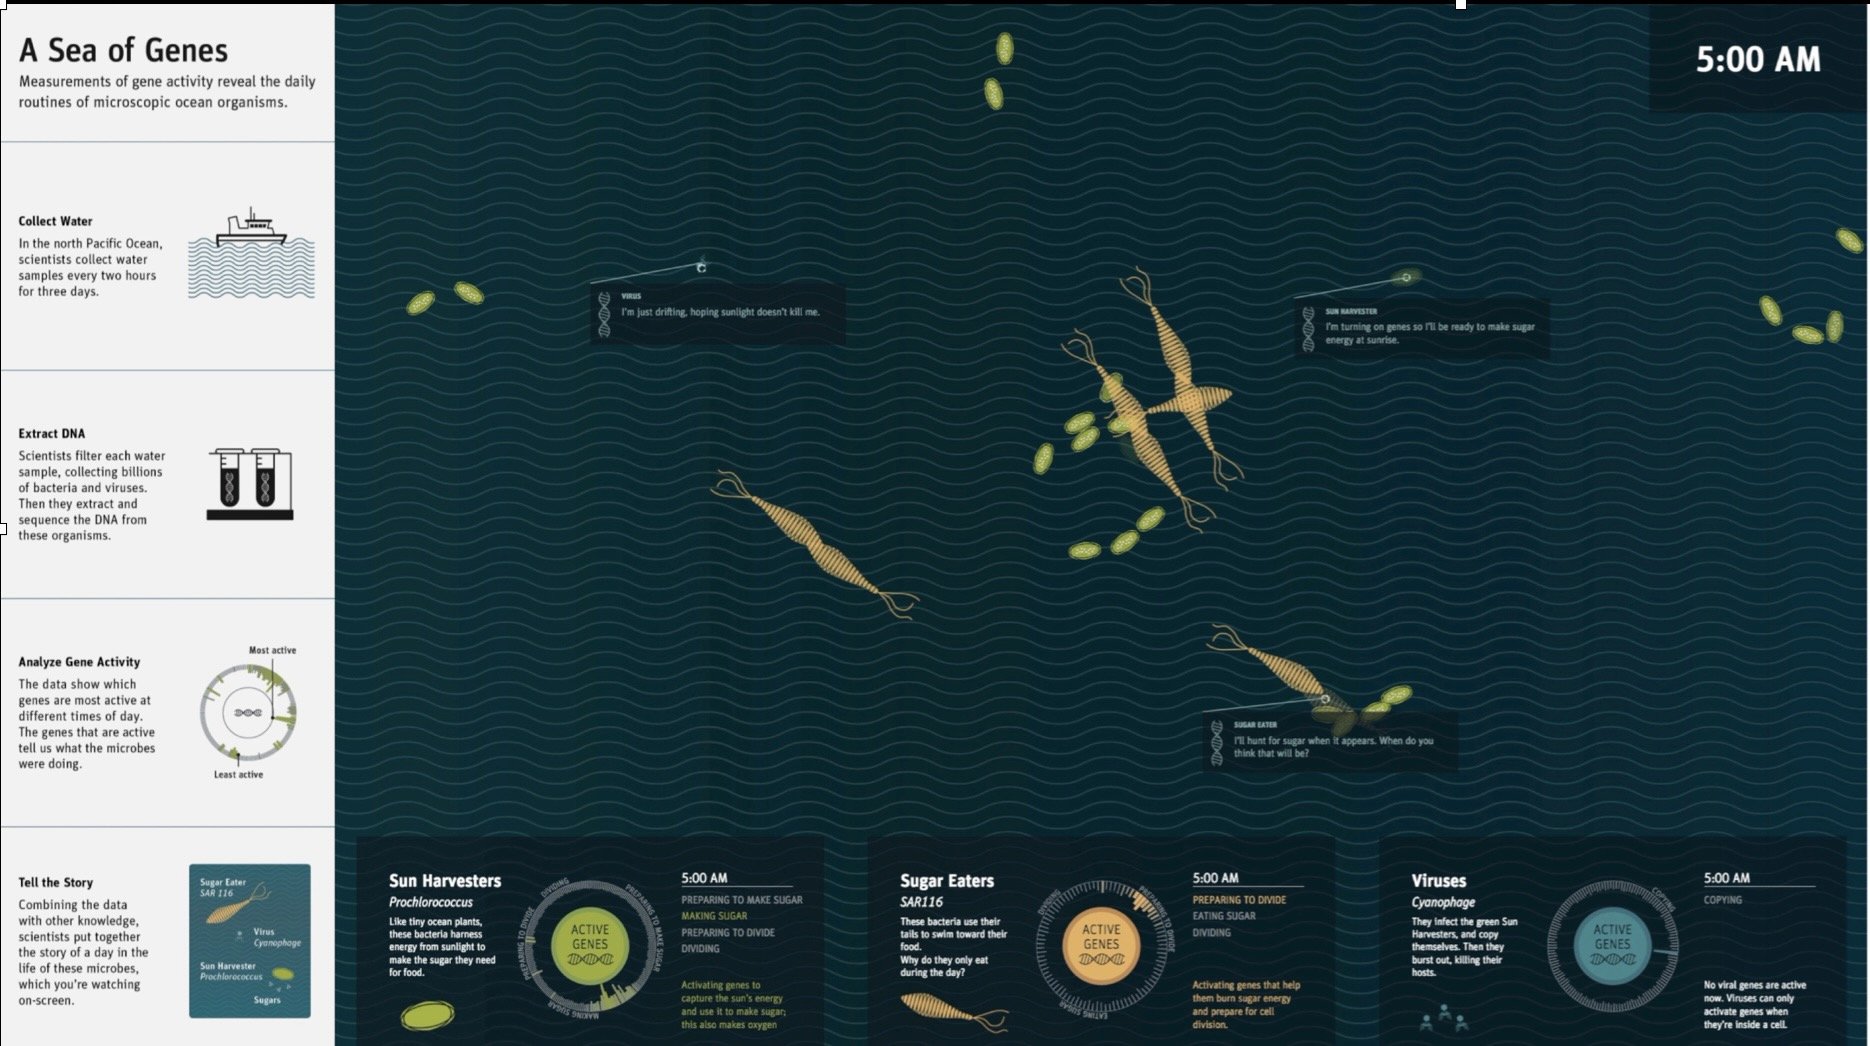
Sea of Genes was an interactive visualization that revealed the daily activities of marine microbes. Using a technique called metagenomics (the same approach used to study the human microbiome) researchers are learning the daily cycles and interactions of the complex microscopic world in the ocean. This exhibit used visualizations as well as narrative elements in labels and annotations to tell the data story of this microscopic world. This exhibit was made with scientists from the University of Hawai’i’s Simons Collaboration on Ocean Processes and Ecology, Stamen Design, and computer scientists at U.C. Davis.
Sharing knowledge across disciplines. In addition to public visualizations and research on learning, a goal of the Living Liquid project was to provide training for the computer scientists, marine biologists, geneticists, and museum professionals working on the team. Graduate students were embedded in the museum design team, having an opportunity to both share their knowledge and to learn about designing visualizations and communications for the public. Inverness Research conducted an evaluation that found high learning value for all professionals involved.


